Mario Brus
10/19/2011 9:14:23 PM
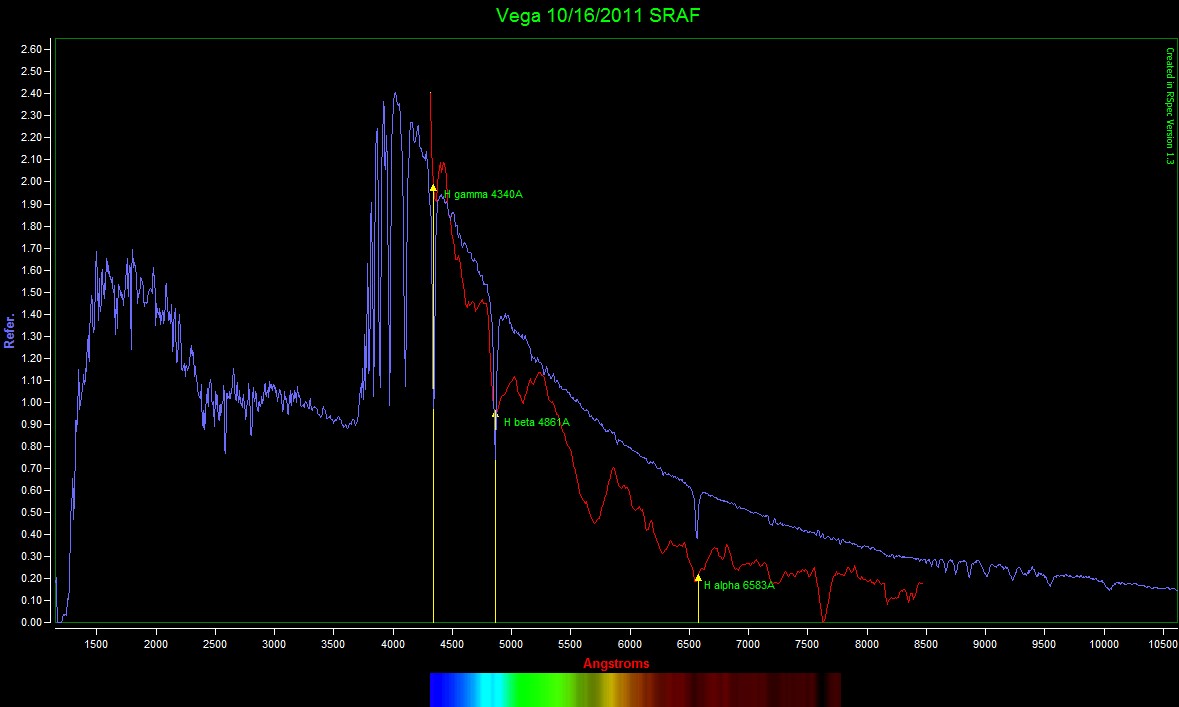
This is the Vega spectral curve (red) that is corrected for the CCD response curve. It is plotted against a standard curve (blue) for Vega that is available in catalogues of stellar spectra. The mathematical manipulations of the original amplitude/wavelength plot does not affect the position of the Hydrogen Balmer lines. You can see that the standard curve is much smoother indicating ideal seeing and very expensive advanced equipment! Conceptually, what we are looking at here are the absorption lines of the hydrogen that exists in the "atmosphere" of Vega. As light passes from the deeper zones of the star's interior, discrete amounts of energy are absorbed by hydrogen in the outer atmosphere that excites electrons to higher energy states. This leaves dark lines in the underlying spectrum. You can look for a variety of elements in this way using standard absorption patterns for the various elements, e.g. He, C, and heavier elements like Fe.
|
